


RERC TECHNICAL ILLUSTRATION PORTFOLIO
This is my portfolio of work from a technical illustration position I hold at the University of Pittsburgh Department of Rehabilitation Science and Technology (RST). In this position, I am responsible for creating technical illustrations and renderings of Pitt RST wheelchair cushion testing equipment and apparatuses for the Rehabilitation Engineering Research Center on Wheelchair Transportation Safety (RERC). The purpose of these illustrations are to be for pamphlets presentations, and webpages when educating individuals on what the Pitt RST department does with regard to wheelchair cushion performance testing. Inspiration for the illustrations was pulled from concept sketches and renders done by industrial and product designers using skills learned through independent study and in my BIOENG 1024 Medical Product Design Course (page linked here).
SKILLS USED:
-
Digital Illustration using the Procreate App with the iPad Pro and Apple Pencil
SUPERIORS:
-
David Brienza, Phd.
-
Alex Delazio, MSc
TIME INVOLVED:
-
Dec 2020 - September 2022
PORTFOLIO
Loaded Contour Indenter (LCI) Illustrations
Image 1
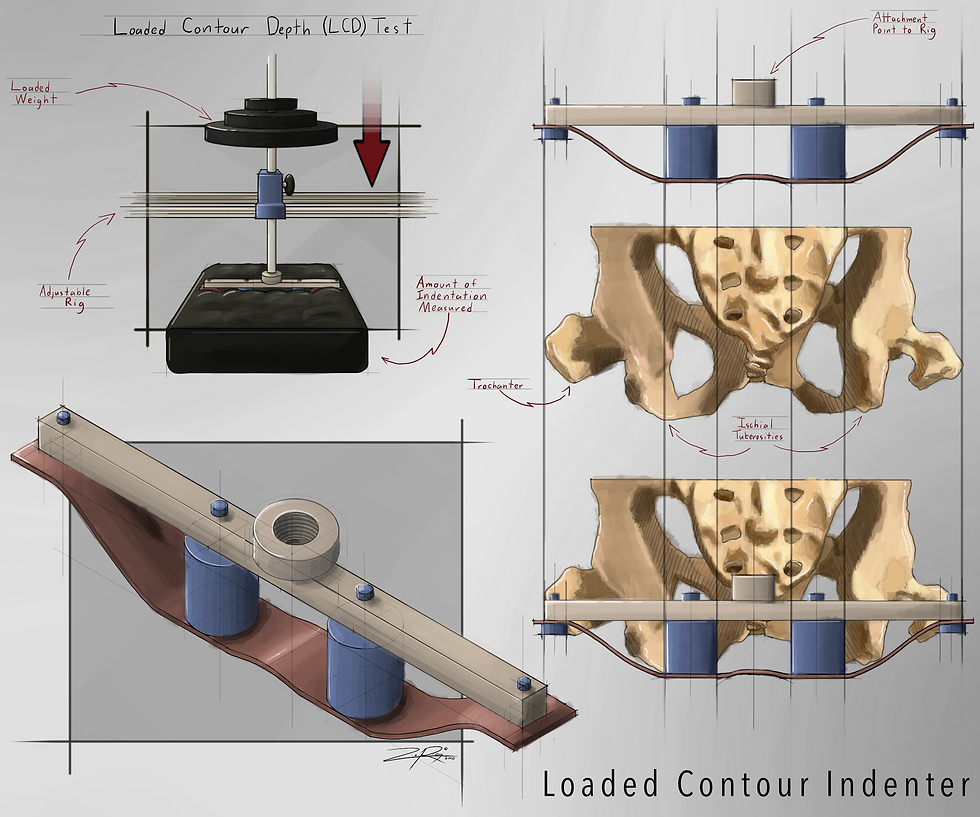
This illustration showcases the Loaded Contour Indenter (LCI). Shapes and proportions of LCI testing components were modeled using diagrams and apparatus building instructions in ISO 16840-2:2018(E).
This sketch in the bottom right is an isometric view of the LCI to highlight its form. The two medial blue cylinders represent the Ischial Tuberosities (ITs) while the two smaller lateral blue disks represent the Trochanters. The red webbing is used as a rough analog to the contours of the buttocks. All components are fixed to the tan support structure and testing rig.
The pelvis diagram on the right side is used to show how the indenter compares to its anatomical analogs.
The diagram in the top left provides a preview of how the LCI would be used during a Loaded Contour Depth (LCD) Test.
Image 2
This is an expanded isometric view of the LCI.

Bulbous Indenter Illustrations


All elevations (E1-E4) are depicted here with associated colors.

Image 1
This illustration showcases the Bulbous Indenter. Shapes and proportions of Bulbous Indenter testing components were modeled using diagrams and apparatus building instructions in ISO 16840-12.
This sketch in the bottom right is a bottom view of the Bulbous Indenter which highlights its form and positioning of the pressure sensors. This specific indenter is comprised out of wood. The wood hemispheres are used as an anatomical analog to the buttocks and aligns with the ITs. There are 8 pressure sensors on each hemisphere. The trochanter buttons align with the trochanters and possess a pressure sensor on each.
The pelvis diagram on the right side is used to show how the indenter compares to the its anatomical analogs.
The diagram in the top left provides a preview of how the Bulbous Indenter would be used during an Envelopment Test.
Image 2
This illustration swapped the Envelopment Test sketch in the top left for a pressure sensor elevation map diagram which shows at what elevation level all the pressure sensors are at. Each color corresponds to a different elevation level.
Image 3-6
These illustrations are focused on highlighting a specific elevation level from E1 to E4.
Image 7
This illustration shows the size comparison between three different standardized sizes of Bulbous Indenters which include: 220 mm, 255 mm, and 380 mm. The numbers represent the radius of the semi-spherical halves.
Rigid Cushion Loading Indenter (RCLI) Illustrations
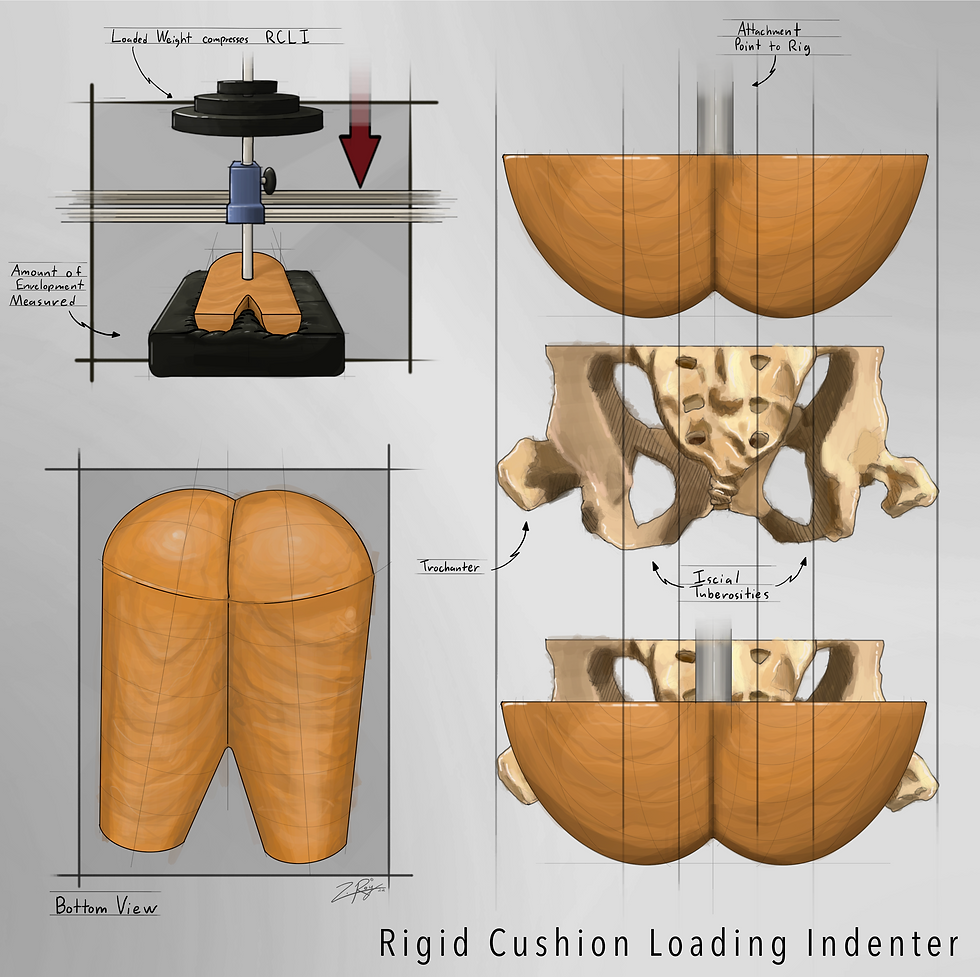
This illustration showcases the Rigid Cushion Loading Indenter Contour Indenter (RCLI). Shapes and proportions of RCLI testing components were modeled using diagrams and apparatus building instructions in ISO 16840-2 and ISO 16840-12.
This sketch in the bottom right is an bottom view of the RCLI to highlight its form and representation of human anatomy.
The pelvis diagram on the right side is used to show how the RCLI compares to its anatomical analog being the legs and buttocks.
The diagram in the top left provides a preview of how the RCLI would be used during a loaded test on a wheelchair cushion.
Test Procedure Illustrations


Loaded Contour Depth Test
This illustration serves to describe the Loaded Contour Depth (LCD) Test Procedure using the Loaded Contour Indenter (LCI) performed by the Pitt RST Department according to its associated ISO Standard. In this test, a loaded weight is applied to the testing apparatus. After 5 minutes, the loaded contour depth is measured. A 33% load increase is then applied and after 1 minute, the first overload deflection is measure. This process is repeated again to get the second overload deflection. The overload deflection measurements are visualized in the simplified schematics below each diagram box.
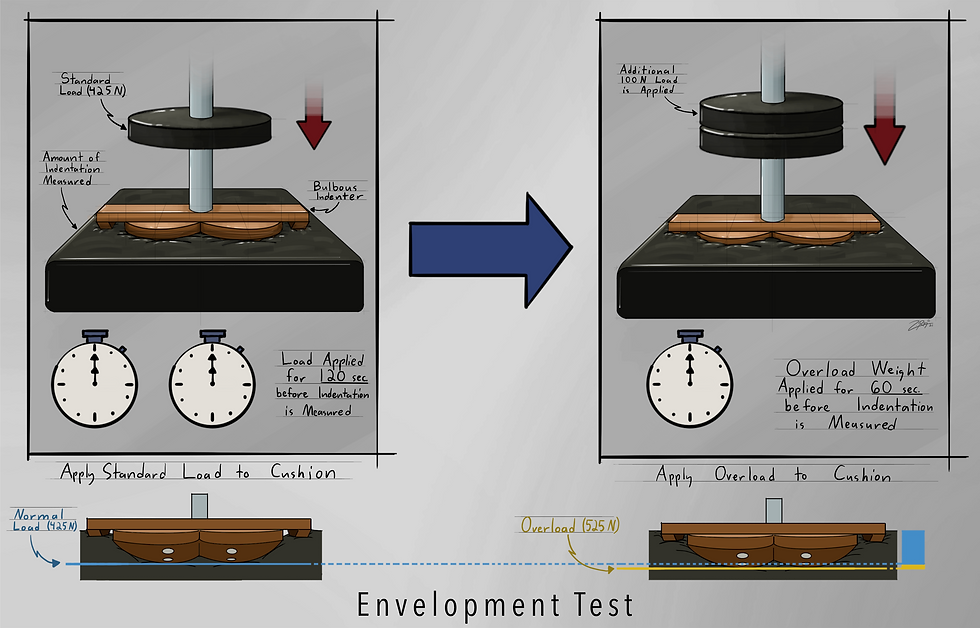
Envelopment Test
This illustration serves to describe the Envelopment Test Procedure using the Bulbous Indenter performed by the Pitt RST Department according to its associated ISO Standard. In this test, a standard load of 425 N is applied to the testing apparatus. After 2 minutes, the Normal Load depth is measured. A 100 N load increase is then applied and after 1 minute, the overload depth is measured. The depth measurements are visualized in the simplified schematics below each diagram box.
Horizontal Stiffness Test
This illustration serves to describe the Horizontal Stiffness Test Procedure using a wooden RCLI performed by the Pitt RST Department according to its associated ISO Standard. In this test, a weight is loaded on the RCLI which rests upon a wheelchair cushion on a rigid platform. A peak force to displace the RCLI 10 mm is generated. After 60 seconds of setting time, the final force is measured.
Lateral Stability Test
This illustration serves to describe the Lateral Stability Test Procedure using a wooden RCLI covered in denim clothing performed by the Pitt RST Department according to its associated ISO Standard. In this test, a live load is applied to a roller which rests on top of the RCLI on a cushion. An inclinometer is used to record the tilt angle. The live load is shifted to tilt the RCLI into the cushion. After 60 seconds, the average tilt angle is determined.
Pressure Mapping Test
This illustration serves to describe the Pressure Mapping Test Procedure using a wooden RCLI performed by the Pitt RST Department according to its associated ISO Standard. In this test, a pressure mapping sensor grid is used to record the high points of pressure on the loaded RCLI. The output image on the right is left blank for insertion of various pressure mapping graphics depending on the use of the illustration.
Microclimate Test
This illustration serves to describe the Microclimate Test Procedure using a thermodynamic RCLI (TRCLI) performed by the Pitt RST Department according to its associated ISO Standard. In this test, warm water is circulated trough the TRCLI for a hour and the TRCLI is loaded and applied to cushion. After 3 hours, the loaded TRCLI is lifted from the cushion. After 1 minute, the loaded TRCLI is reapplied to the cushion for 15 minutes.
Impact Damping Test
This illustration serves to describe the Impact Damping Test Procedure using a heavy RCLI performed by the Pitt RST Department according to its associated ISO Standard. In this test, the RCLI is elevated on a rigid platform at a 10 degree angle. The block is swiftly removed horizontally. Repeat this twice and compare the impact ratios.
Shifting Focus
In May 2022, I began shifting focus to illustration and design work with the Healthy Home Laboratory (HHL). From May 2022 onward, I still engage with special RERC projects such as creating graphics for a Rolling Resistance Calculator with PhD student, Holly Wilson-Jean. The research publication for this project, which includes my illustration work, can be found HERE.
Return my Research & Design Portfolio for various projects I have developed and contributed to with the Healthy Home Laboratory (project titles designated with HHL).